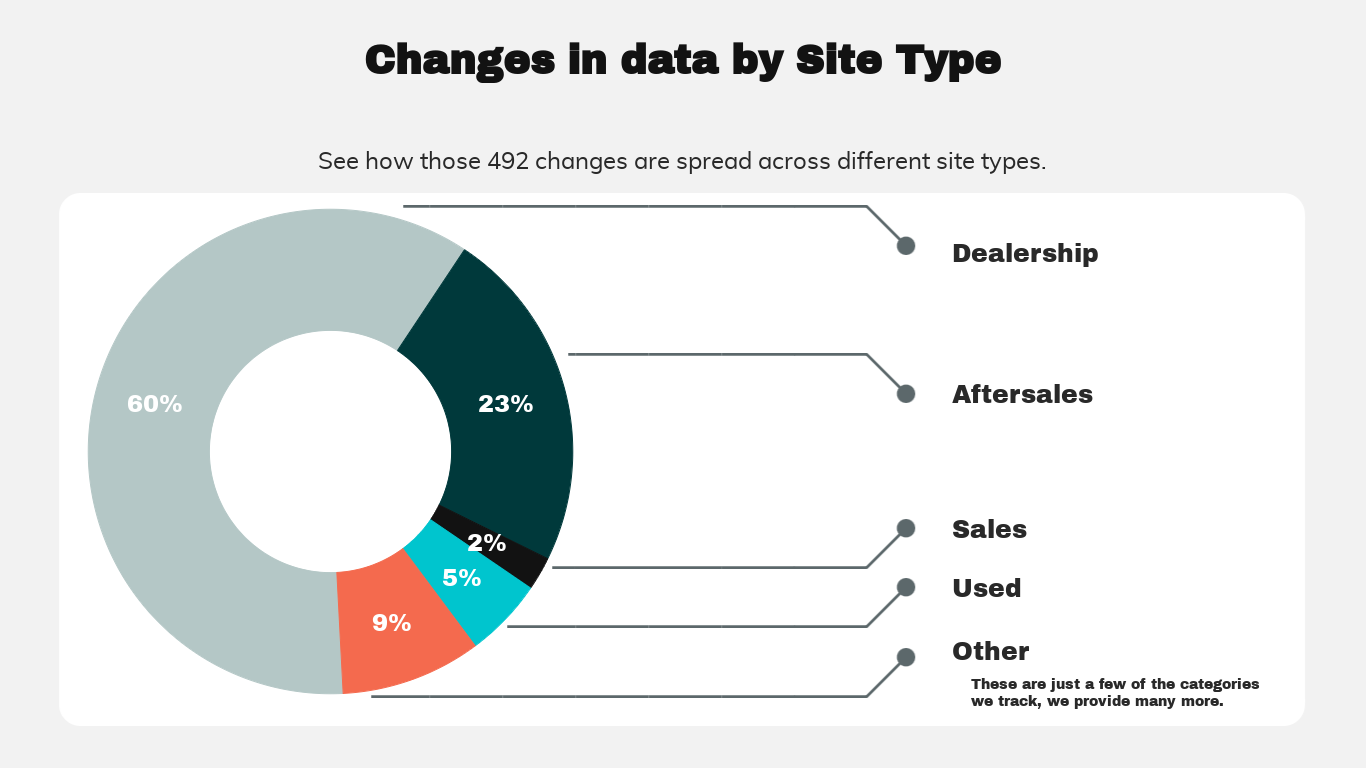
This months network analysis shows a little slower progress from the previous month, with dealership changes slowing overall from 647 to 492 overall. However, we’ve still managed to rack up 23 changes per day for Car, LCV, HGV and Motorcycle and ATV.
Analysing the dealership data from August displayed on a geographical map, we can easily identify and observe exactly where significant changes have occurred by region. This visual representation allows for a clearer understanding of trends and patterns across different areas.
Looking at the pie chart for this month, we can see how the data was spread across the different site types. We have analyised dealerships, aftersales sites, used car sites and more.
The months analysis of what’s changed could be shown in over 20 categories. For the purpose of simplicity, we’ve sampled: Franchised Appointed, Franchise Relinquished, Site Relocation and sites that have been taken over by way of a group acquistion.


