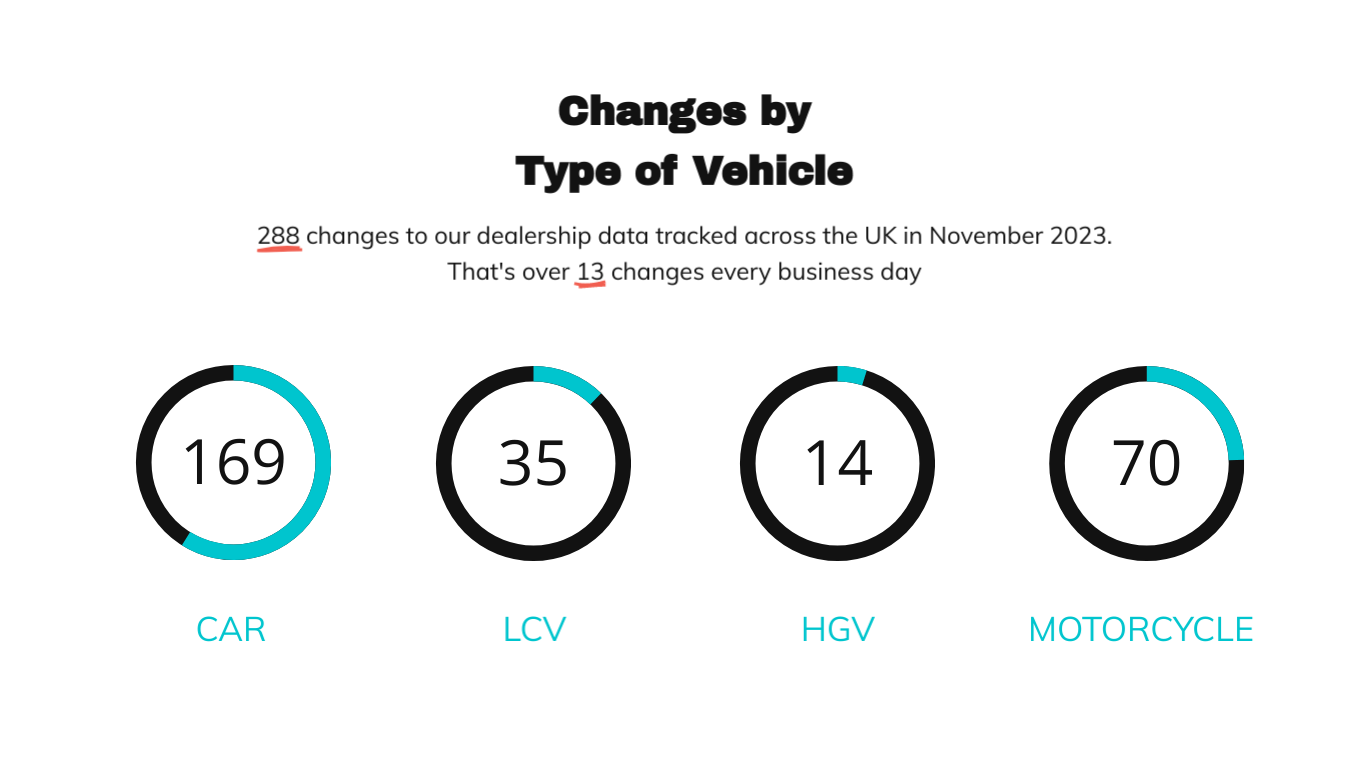
A quiet November across the vehicle Dealership networks. This months movements produced 288 changes, giving us a reduction of 105 vs October.
Updates to dealerships by type of vehicle are represented in the graphic above. We recorded 169 (213) for car, 35 LCV (64), 14 HGV (24) and 70 motorcycle and ATV (92). Octobers figures are shown in brackets.
November 2023’s updates by Dealership location are represented in the UK map above. In this image, it is easy to see exacly where in the country the changes occured. Existing clients clients can easily toggle different categories of Dealerships on and off, as well as identifying trends and specifics via date ranges.
This months (again, we’re showing October in brackets) data update by site type identifies Dealerships as the biggest movers at 55% (54%), aftersales 18% (19%), Sales 1% (3%) and used 7% (10%). Changes in ‘other’ categories 19% vs 14% in October.
When it comes to breaking data down by a multitude of different categories, we’re certainly not shy. This sample demonstrates a few of the datasets available. 67 franchises appointed (vs October at 74), 49 franchises relinquished (vs October at 37).
For a small annual subscription, we also produce a bi monthy dealership report. This is particularly useful for those who wish to use frequent change data for prospecting car dealerships, you can see more on the detail of that report here.


