Viewing entries in
Data Update

Dealership Network Update December 2024

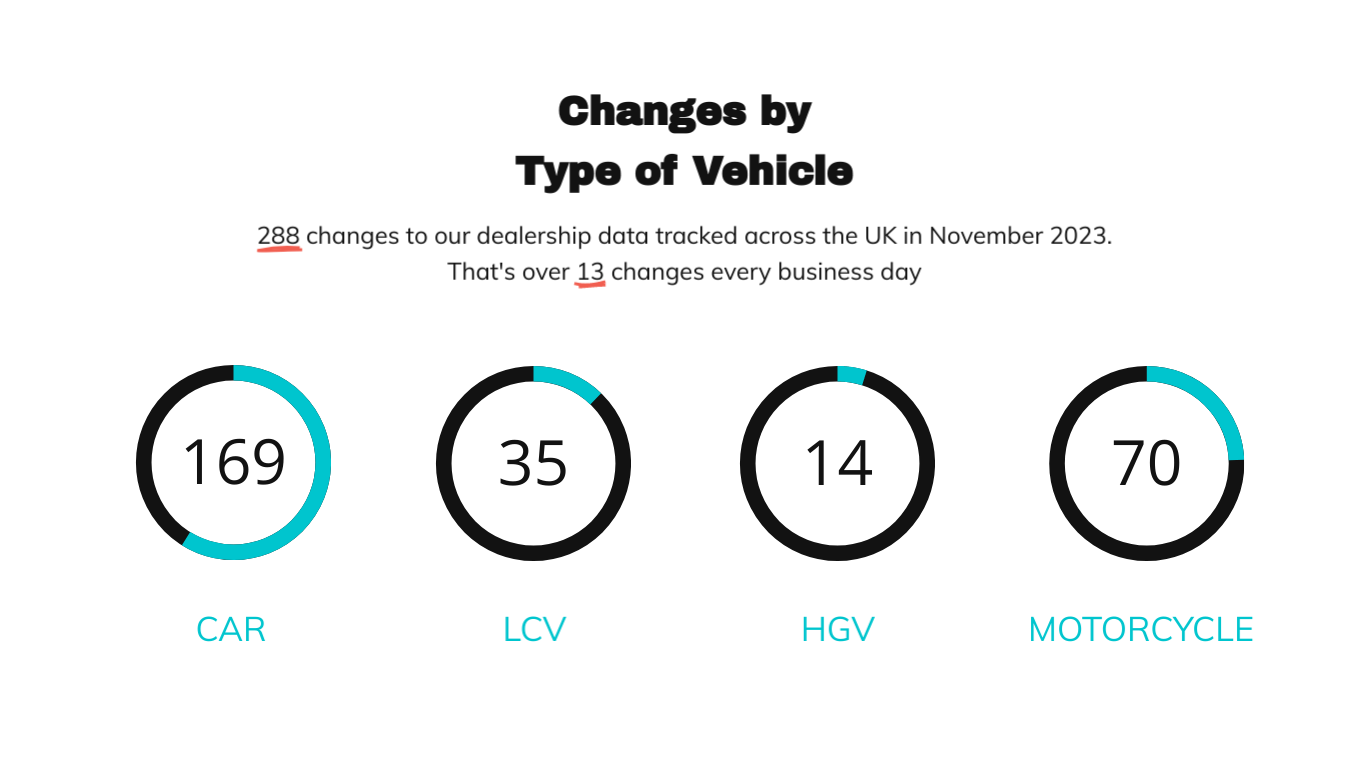
As we come to the end of 2024, the usual slowdown has taken its toll. We’ve recorded 270 changes throughout December 2024, that’s still over 13 changes every business day though.

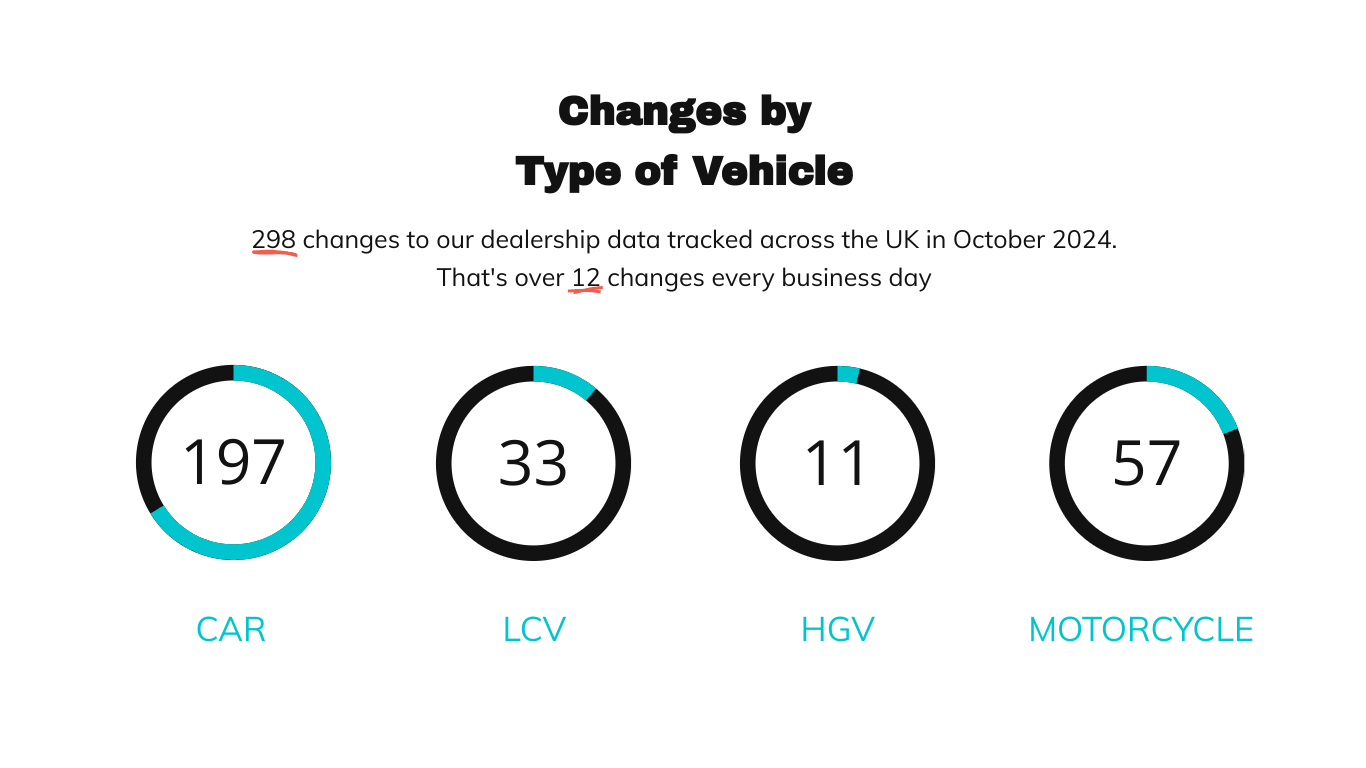
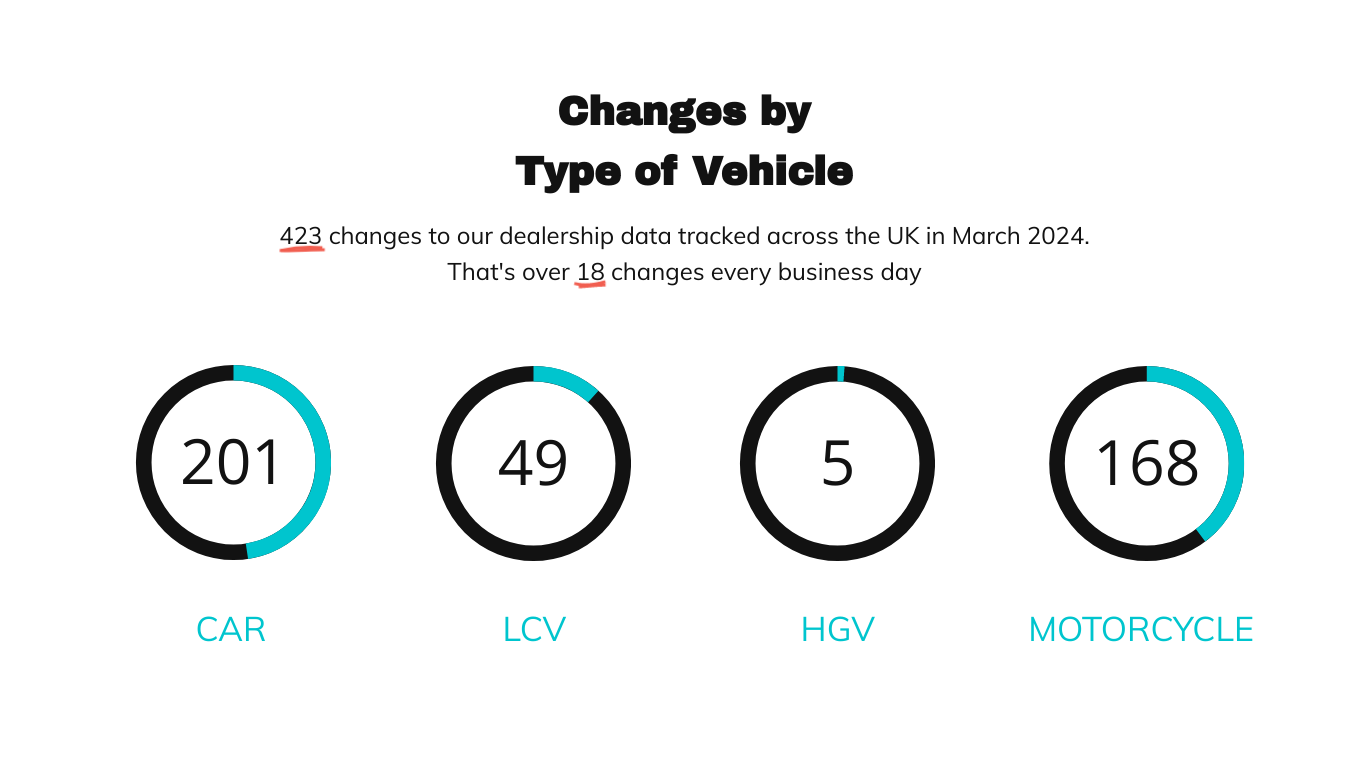
Breaking down December’s changes by vehicle type, gives us 178 for Cars, 19 for LCV’s, and 73 for Motorcycles.

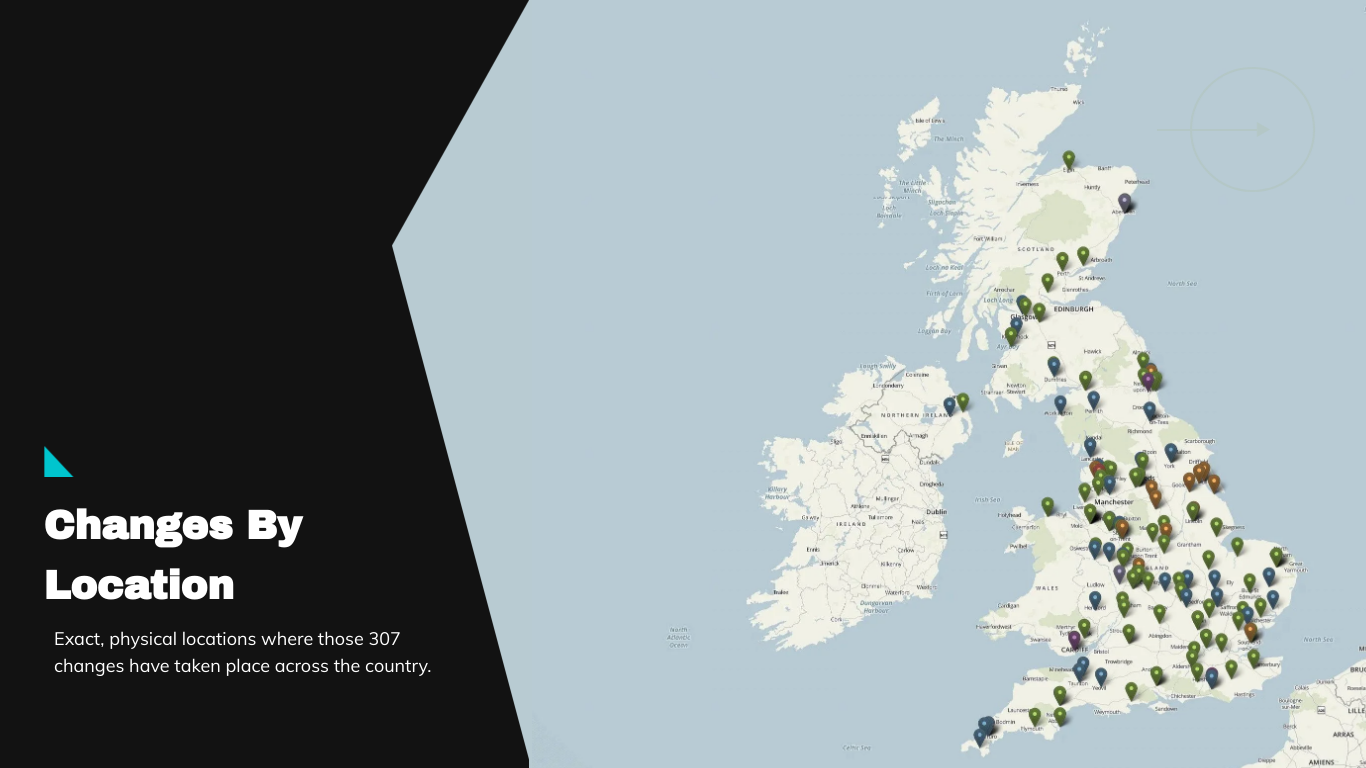
Noting the changes is made easy by our Autosites system, you can toggle the pins for site type changes on and off very easily in the menu. In the graphic below, we’ve shown all changes for the month.

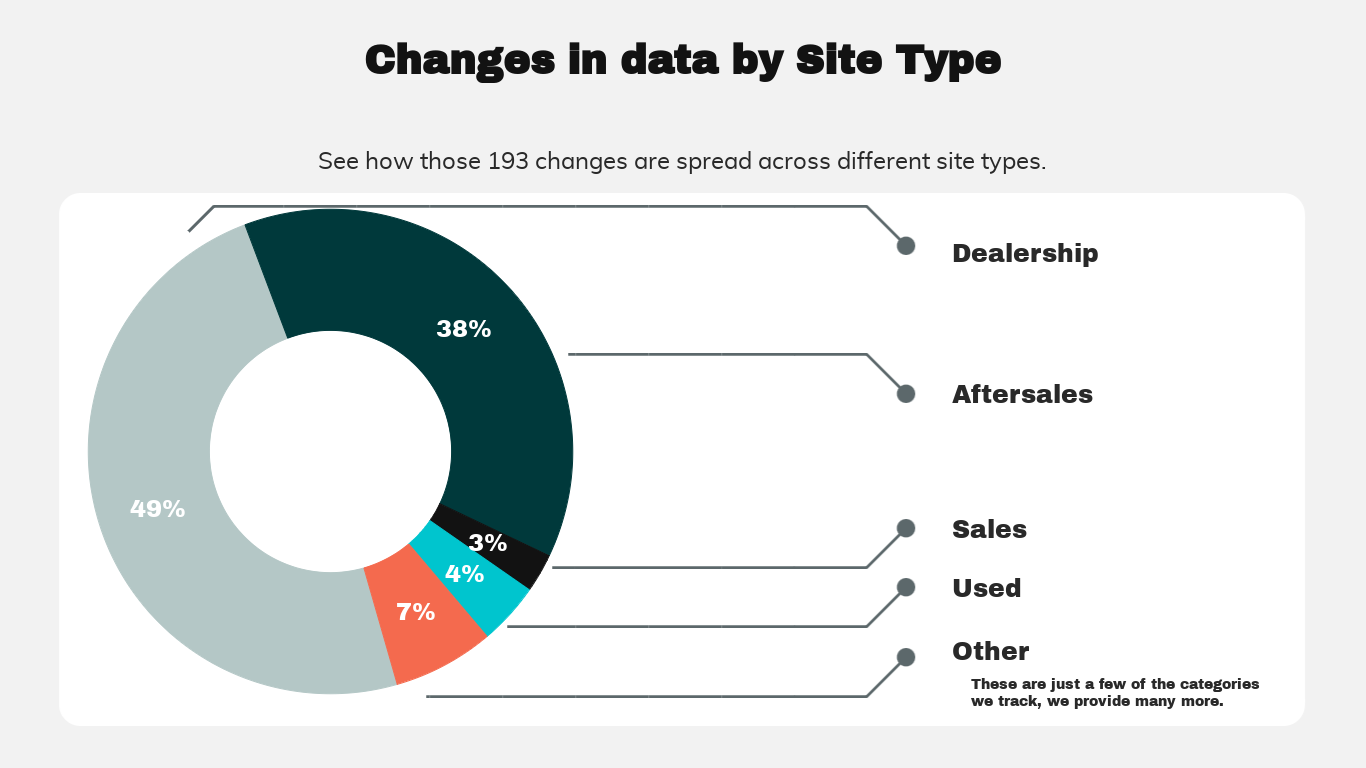
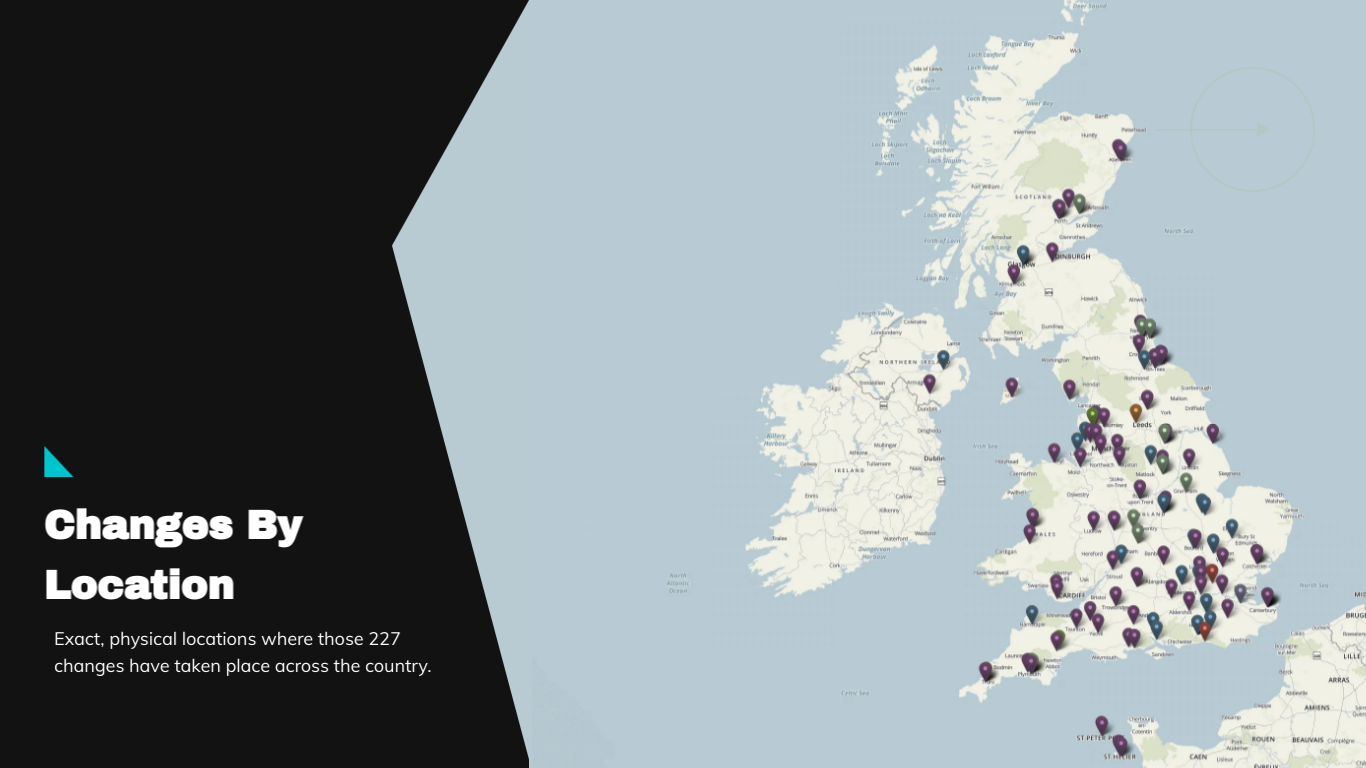
Next up, our infographic illustrates data changes by site type. There are numerous categories tracked within our system, here we’ve just shown a sample of the key ones.

December 2024 UK Changes in data by Site Type.

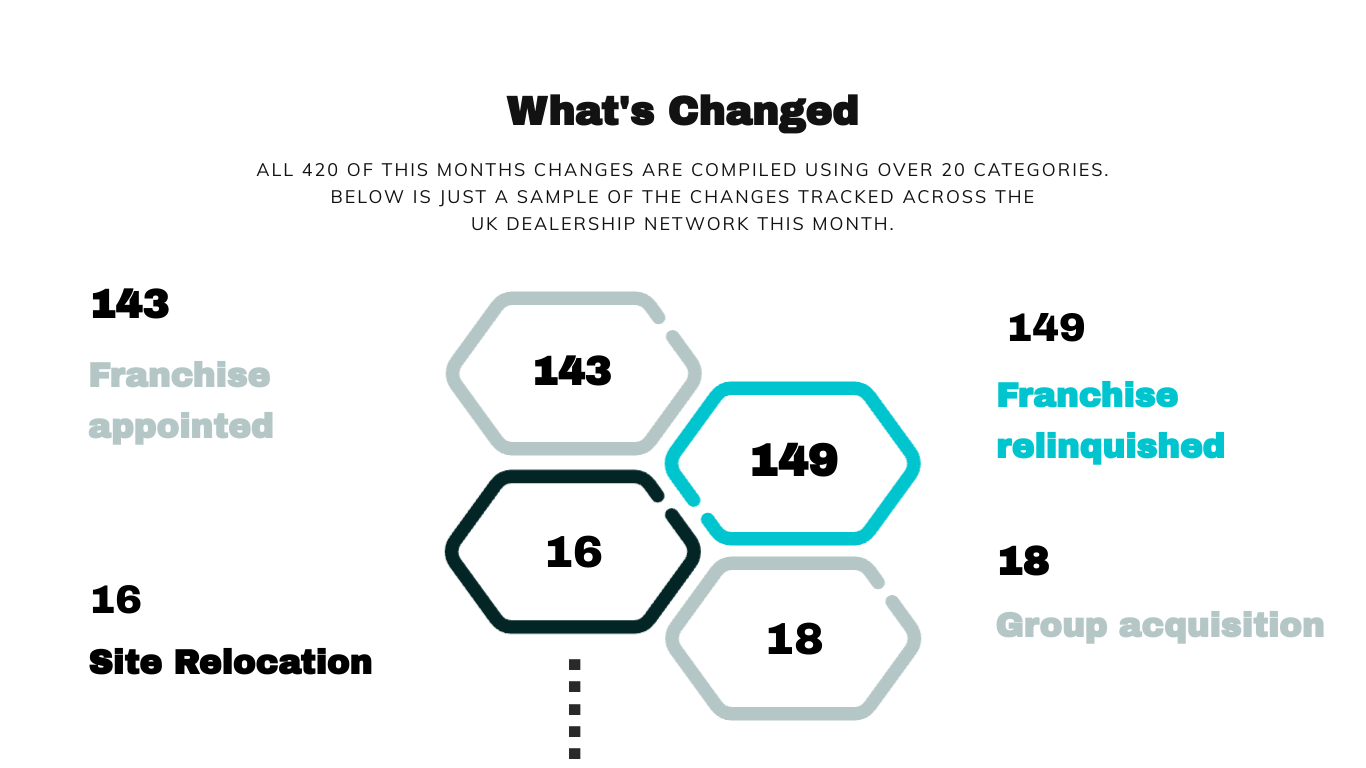
The ‘type’ of change category pulls together all of the updates within the different types of site. For this month, the bulk has been made up of new appointments, terminated franchised agreements and acquisitions.

December 2024 UK Changes in Data by Type of Change

Dealership Network Analysis November 2024

In our November 2024 update, we’ve recorded a ‘not too shabby’ 438 changes within the UK dealership networks. That equates to over 20 changes each business day.

We rank and file these updates across all vehicle catagories. For November, we have Car at 309, LCV at 37, HGV at 9 and Motorcycle at 65.

November 2024 UK Changes by Type of Vehicle

Our map tells you all you need to know about, where in the UK Novembers changes occurred.

With the data by Site Type, we can show how our 420 changes were apportioned amongs the different type of site. This month, aftersales were on par with dealerships.

Changes in Data by Type of Change breaks down the different categories we track (sample is shown below in the graphic).


Dealership Network Analysis October 2024

Dealership Network Analysis October 2024

Octobers figures amount to a total of 298 changes throughout the franchised dealer networks. Our tracking has reported over 12 changes every business day.

We cover all types of vehicle in our analysis. For October we’ve broken the changes down by Car (197, LCV (33), HGV (11) and Motorcycle (57).

Network Changes By Geographical Location

In the graphic above, we given some context by highlighting where Octobers movements occured by location.

Dealership Changes in data by Site Type

We also track the changes by site type. Out of the 298 changes for October, dealership changes outweigh the other categories with aftersales coming in second.

Breaking the categories down by the type of change, gives us insight into the reason for change. We track many categories, those illustrated above are a sample.


Dealership Network Update June 2024

Intro Dealership Network Report Update June

June 2024’s update totals 193 changes across the UK Vehicle dealership networks. We’ve broken the movements down by vehicle type in the graphic below:

Image Changes By Type Of Vehicle June 2024

The geographical changes by location for June 2024 are illustrated in the map view:

Image June 2024 Report By Dealership Location Map View UK

The pie chart demonstrates how the changes occurred across the different site types for the month:

Image June 2024 Data Report By Site Type

We track changes over multiple categories, we’ve included a few to demonstrate how these can be broken down:

Image June 2024 Network Report By Franchise Category

DEALERSHIP TREND REPORT MAY 2024

Image May Dealership Network Report Header 2024

Let’s face it, a Dealership trend report is a useful ally if you are involved in network planning activities. Spotting opportunities without the right data can, however lead to lost opportunities and inefficiencies. Enter our Dealership report for May 2024. Used with previous months data, it can help spot trends and give insight that others may have missed. This month for example, we’ve racked up 273 changes (vs 394 in April). Have we been lazy? No. It’s just been a little quieter than previously.

Image May 2024 Report Dealership by Type of Vehicle

The updates to Dealership by type of vehicle have declined over the past month. April’s figures are shown in brackets: Car 128 (198), HGV 2, (10), LCV 62 (94) and Motorcycle/ATV 81 (93).

Image May 2024 Report By Dealership Location Map View UK

The map shows the geographical changes by location.

Image May 2024 Data Report By Site Type

Our report on data updates by site type shows Dealerships making up most of the changes for this month at 58%, a miniscule decrease from the previous month (57%). Aftersales is represented at 26% (vs 23%), used at 7% (9%) and the ‘other’ category down at 6% (10%).

Image May 2024 Network Report By Franchise Categor

Never suffering from a lack of categories in our dataset, we monitor and report on a multitude. For May 2024, we’ve recorded the following: 105 franchises appointed (vs April at 91), 80 franchises relinquished (vs April at 96), 3 dealership relocations (vs 17 in April) and 9 name changes (vs 42 in April).

Dealership Trend Report (Locations) March 2024

Image March Dealership Network Report Header 2024

JS Management makes it easy to track Dealership locations with our data. Here we’re reporting movements UK wide, across many different categories and vehicle types. If you have the time, you can easily compile Dealership trend reports by looking at our previous updates. In this post we are representing changes through March 2024.

Dealership changes by type of vehicle have increased overall from 388 to 423 since February (breakdown figures are shown in brackets). Car 201 (262), HGV 5, (16), LCV 49 (41) and Motorcycle/ATV 168 (69).

Image March 2024 Report By Dealership Location Map View UK

The UK map clearly reports where the changes have occured through March 2024

This months changes in data by site type report Dealerships taking up a fair chunk of the movements for the month at 64%, an increase from the previous month (52%). Aftersales is represented at 23% (vs 29%), used at 6% (5%) and the ‘other’ category down to 5% vs 10% in February.

Image March 2024 Network Report By Franchise Category

As we wind down our report for March, we’ll end with changes by franchise category. There are 96 changes by franchise appointed (vs 81 in December), 138 franchises relinquished (vs 85) and 25 site relocations (vs 16) in the previous month). Group Acquisitions, have reduced somewhat this monh, totalling 10 (vs 54 previously).

DEALERSHIP NETWORK UPDATE FEBRUARY 2024

Image February Dealership Network Update Header 2024

Our update for February 2024 gives an insight into the increases across the network since January. This month we have seen an increase of 81 in total. This represents 18 changes per business day.

Image February 2024 Updates to Dealership by Type of Vehicle

Dealerships by type of vehicle have increased since January (figures are shown in brackets). Car 262 (186), HGV 16, (11), LCV 41 (34) and Motorcycle/ATV 69 (76).

Image February 2024 Updates By Dealership Location Map View UK

February’s account of where the movements occured physically is shown in the map image.

Image February 2024 Data Update By Site Type

Changes by site type shows Dealerships taking up the majority of the movements for this month at 52%, a slight decrease from the previous month (49%). Aftersales is represented at 29% (vs 34%), used at 5% (8%) and the ‘other’ category 10% vs 7% in January.

Image February 2024 Network Update By Franchise Category

Finalising Februay’s figures we’re showing changes by franchise category. We’ve totalled 81 changes by franchise appointed (vs 49 in December), 85 franchises relinquished (vs 102) and 16 site relocations (vs 20) in the previous month). Significantly up though are Group Acquisitions, coming in at 54 (vs 12 previously).

Dealership Network Update January 2024

Image January Dealership Network Update Header 2024

January 2024’s numbers are steadily rising over the previous month. Across the dealership networks, we’ve recorded 307 changes (vs 227 previously) for this month alone. This represents 13 changes per business day.

Image January 2024 Updates to Dealership by Type of Vehicle

Changes to Dealership by type of vehicle has increased since December, with the exception of the LCV category, which has shown a decrease of 23 changes. Decembers figures are shown in brackets: Car 186 (139), HGV 11, (3) and Motorcycle/ATV 76 (28).

Image January 2024 Updates By Dealership Location Map View UK

We’ve mapped out the Dealership changes for January on the UK map graphic above.

Image January 2024 Data Update By Site Type

The data update by site type shows Dealerships taking up the bulk of the changes for this month at 49%, a slight decrease from the previous month (52%). Aftersales is represented at 34% (vs 30%), used at 8% (9%) and the ‘other’ category the same at 7%.

Image-January-2024-Network-Update-By-Franchise-Category

We conclude Januarys figures with an update to the changes by franchise category. We’ve totalled 49 changes by franchise appointed (vs 69 in December), 102 franchises relinquished (vs 52) and 20 site relocations (vs 7 in the previous month).

Dealership Network Update December 2023

December Dealership Network Update Header 2023

The December Dealership network update brings a fairly quiet close to the year. We recorded 227 changes for this month vs November’s figure of 288. Thats 12 changes per business day.

November 2023 Updates to Dealership by Type of Vehicle

The updates to Dealership by type of vehicle have declined since November, with the exception of the LCV category, which has shown an increase of 22 changes. Novembers figures are shown in brackets: Car 139 (169), HGV 3, (14) and Motorcycle/ATV 28 (70).

December 2023 Updates By Dealership Location

Dealership location changes for December are illustrated on the UK Map in the graphic above.

December 2023 Data Update By Site Type

December 2023’s data update by site type is as usual, dominated by Dealerships. 52% in fact. Marginally down from from the November figure of 55%. This month aftersales sites show a significant increase over the previous month, 30% (from 18%). The used figure of 9% is similar to previous one at 7%. The ‘others’ category has shrunk from 19% to just 7% this month.

December Network Update By Franchise Category

Finising off with the update with changes by franchise category, we’ve totalled 69 changes by franchise appointed (vs 67 in November), 52 franchises relinquished (vs 49) and 7 site relocations (vs 17 in the previous month).

Contact JS Management

Dealership Network Update November 2023

November Dealership Network Update Header 2023

A quiet November across the vehicle Dealership networks. This months movements produced 288 changes, giving us a reduction of 105 vs October.

November 2023 Updates to Dealership by Type of Vehicle

Updates to dealerships by type of vehicle are represented in the graphic above. We recorded 169 (213) for car, 35 LCV (64), 14 HGV (24) and 70 motorcycle and ATV (92). Octobers figures are shown in brackets.

November 2023 Updates By Dealership Location

November 2023’s updates by Dealership location are represented in the UK map above. In this image, it is easy to see exacly where in the country the changes occured. Existing clients clients can easily toggle different categories of Dealerships on and off, as well as identifying trends and specifics via date ranges.

November 2023 Data Update By Site Type

This months (again, we’re showing October in brackets) data update by site type identifies Dealerships as the biggest movers at 55% (54%), aftersales 18% (19%), Sales 1% (3%) and used 7% (10%). Changes in ‘other’ categories 19% vs 14% in October.

November Network Update By Franchise Category

When it comes to breaking data down by a multitude of different categories, we’re certainly not shy. This sample demonstrates a few of the datasets available. 67 franchises appointed (vs October at 74), 49 franchises relinquished (vs October at 37).

For a small annual subscription, we also produce a bi monthy dealership report. This is particularly useful for those who wish to use frequent change data for prospecting car dealerships, you can see more on the detail of that report here.

Dealership Analysis Report October 2023

October-2023 Dealership Network-Update

The October Dealership Analysis Report shows an increase in activity over September. We’re up closer to 400 changes, giving us an increase of precisely 41.

October 2023 Changes to Dealership by Vehicle Type

Breaking the month down for changes by type of vehicle, we’ve totted up 213 on passenger car, 64 on light commercials, 24 on heavy goods vehicles, and finally 92 on motorcycle and ATV. This gives us more than 18 every business day.

October 2023 Change By Dealership Location Type

This months fluctuations in the Dealership network can be conveniently represented across the UK, as we demonstrate here in our map. Clients can easily toggle between different data sets in our Autosites platform. It’s as easy as checking a box (really!). If you are an SMMT data subscriber, you could overlay this with registration data.

October 2023 Data Change By Site Type

Breaking the data down by site type, we can see that Dealerships report the largest change category change at 54%, aftesales sites come in second with 19%, used sites at 10% and sales (new) at just 3%. Others, (which is a mixed bag of additional categories we track) come in at 14%.

October Change By Franchise Category

October’s monthly numbers by franchise category demonstrate our ability to provide insight, by tracking a plethora of different categories. In the mix for this month we’ve uncovered 74 franchises appointed (vs Septembers 58), 37 franchises relinquished (vs Septembers 82).

We also produce a bi monthly report of data changes by the different categories. Very reasonably priced, and delivered straight to the users inbox. Ideal for those who want to use our data for prospecting dealerships, based on their change profile. As well as a detailed .csv file, there is a pdf report explaining the contextual relationship across the various brands.

See you in November.

Dealership Analysis Report September 2023

Header Image September 2023 Dealership Analysis Report

Less activity for September 2023’s Dealership Analysis Report, giving us some 352 changes accross the networks. We can report a slight uplift in the numbers for HGV and Motorcycle though.

Image September 2023 Changes By Vehicle Type

For September 2023, changes by vehicle type are represented thus: Car - 199, LCV - 51, HGV - 17, Motorcycle - 85. This equates to 16 changes per working day for the period.

Image UK Dealership Changes By Location September 2023

Map - UK Dealership Changes By Location September 2023

Not wishing to leave our clients without the full picture, we’ve plotted September’s changes on a UK map. For users of the full product, drive data is available. This makes it easy to visualise distance between any multiple of different queries.

Image September 2023 Changes By Site Type

Although the overall numbers are down, this months changes by site type show similar percentages to August, across all sites.

Image September 2023 Change By Franchise Category

September’s month changes by category, provide an insight into another available data set. Since there are over 20 of these categories, we’ve just picked out a few to keep things concise. September gives us 56 vehicle franchises appointed (vs 79 in August) and 82 relinquished (vs 108 in August).

Our bi monthly dealership update report is useful for those who are interested in a detailed representation of ‘what’s changed’. A trend tracker if you will. More details are available: https://www.jsmanagement.com/franchised-dealership-update-report

Until next month…